Summer break update
Published:
Classes ended a few weeks ago and I'm soaking up as much sun as possible. In place of tedious coursework, I'm now free to focus on my research, both personal and otherwise! This is a welcome respite, as these past two semesters have been difficult both because of the workload and lack of any contiguous breaks during the semesters (the regular breaks were broken up and peppered throughout the semester as wellness days
). However, next semester is already looking much better, as classes are said to be in person and some level of normalcy will resume. Let's hope that this decision is the correct one!
During the summer months I enjoy keeping myself busy with various personal projects concerning things I am interested in but never had the time to explore during the semester. My research notebook is fat with ideas but now that I'm a graduate student, I've only a little more time than the regular semester to work on these things during the summer! That's quite alright though, since there is considerable overlap between what I find interesting and my current research. When I have the time, I'll be sure to post updates on this blog. There is at least one project in the process of being posted, so stay tuned for that. I've also been active elsewhere, making a blog post on the GG Scholars website about inequities in COVID-19 vaccine distribution. You can read my post here.
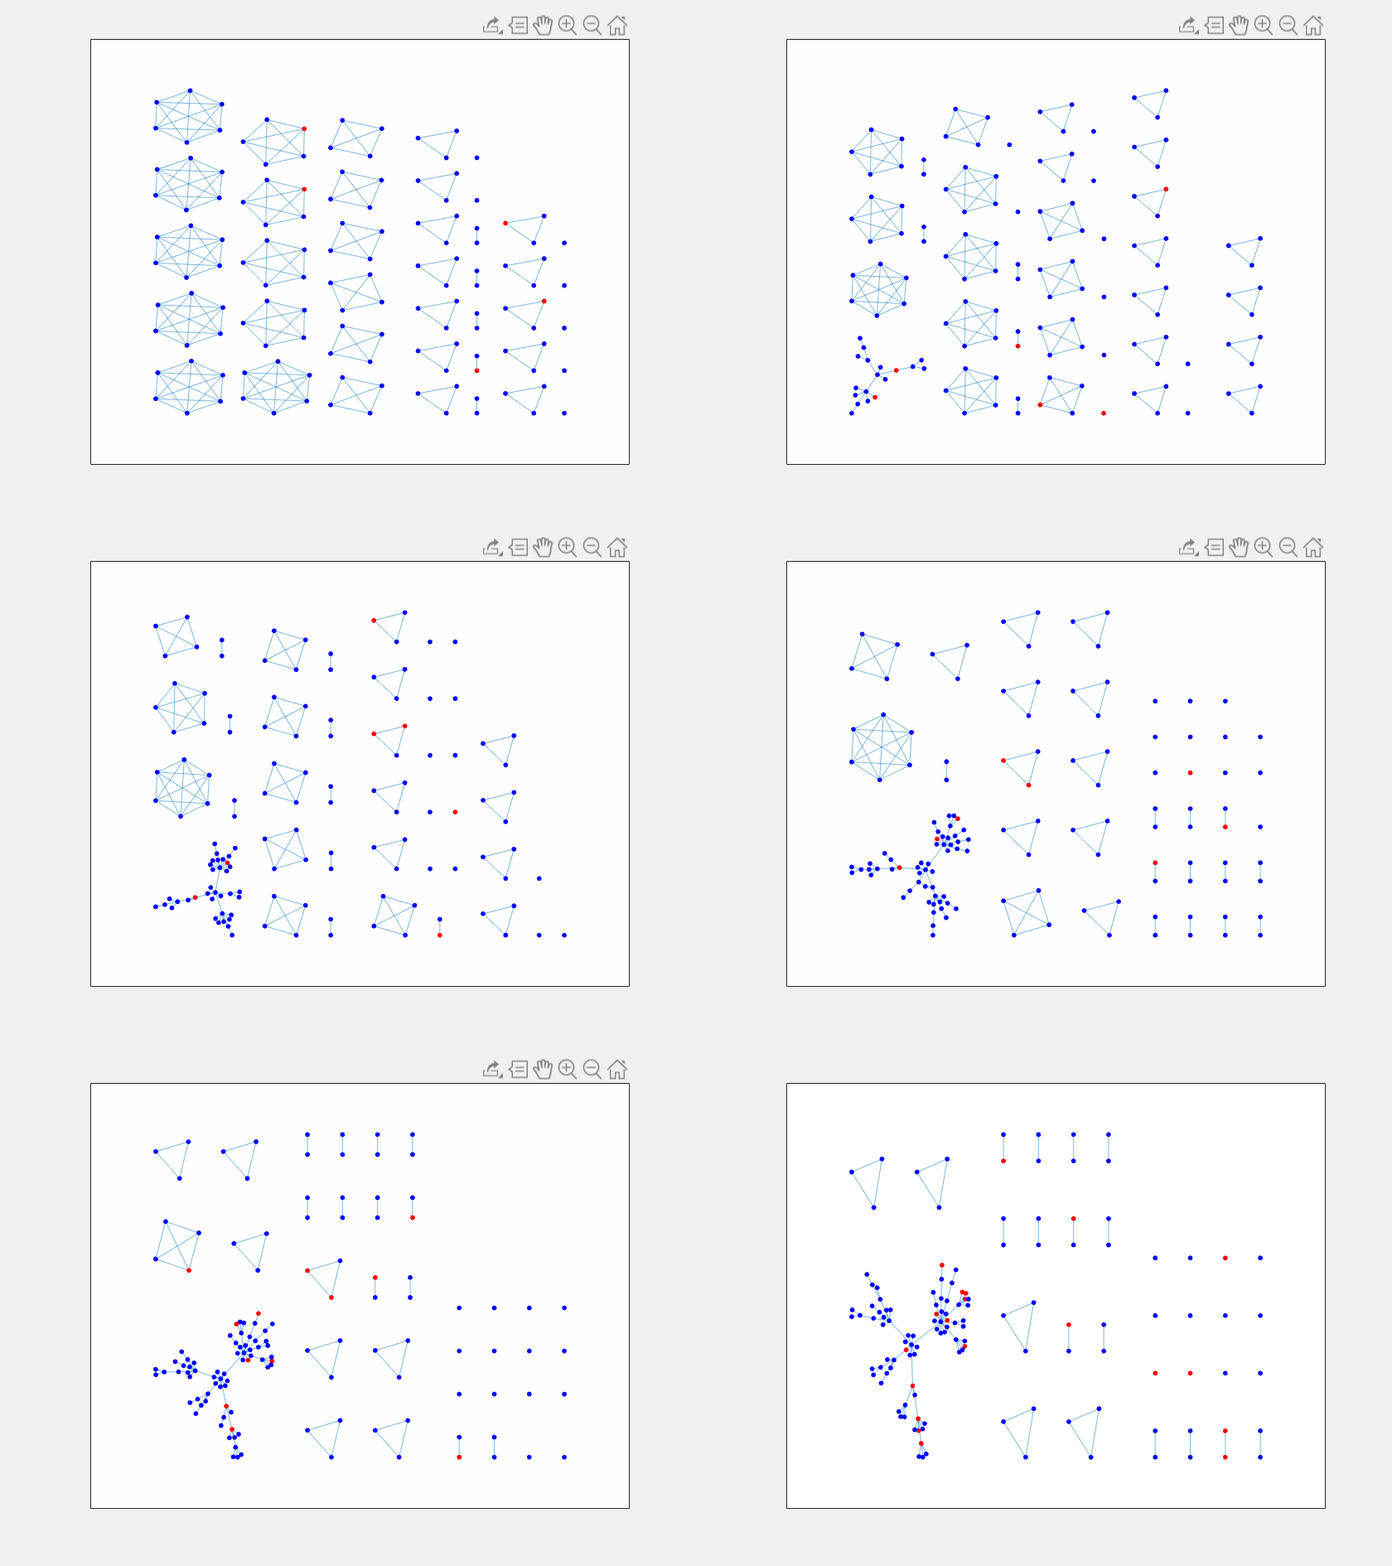
In the meantime, enjoy the beginning of a project I started a year ago following my involvement in a research program through the American Institute of Mathematics. The idea was to construct a household model of COVID-19 with community transmission. Individuals would leave their household units (modeled by well-connected graphs) and mix in a community network, modeled according to a B-A algorithm. The project never really took off, as I was starting graduate school and had a million other things to do (like finding a place to live!), but I still managed to produce some interesting graphs. Please excuse the jumbling
of the graphs in the figure below! Since each household is an individual graph, it was very difficult to get all the graphs to remain in the same place as the plots were updated. Oh well!

