
The effect of clustering on disease eradication
Published:
Some time ago as part of a course on agent-based modeling, we were tasked with developing and analyzing our own model as a final project. At the time of the class, there was a large outbreak of measles in Samoa, so I had wanted the project to somehow relate to measles. In the case of Samoa, the primary reason for the explosive growth of the outbreak was ascribed to the abysmally low levels of measles vaccination at the time. Coincidentally, the Samoan outbreak occurred alongside a strong resurgence of the disease in the United States, at one point potentially threatening its elimination status [7]. These outbreaks, as well as outbreaks in the past, shared a common element of occurring in communities of unvaccinated individuals, most notably Orthodox Jewish communities. The issue of communities of unvaccinated individuals and their roles in promoting the spread of disease seemed an interesting approach to the wider problem of herd immunity, and so I eventually resolved on this as my project.
The clustering of under-unvaccinated or unvaccinated individuals in a population is not a new phenomenon and has been studied before, both in the context of identifying such clusters [1], and exploring how this clustering affects disease transmission and prevention efforts [4,5]. There is also a fair amount of media attention surrounding the issue as well. The scientific consensus is that the clustering of unvaccinated individuals makes the population as a whole more vulnerable to a disease outbreak. But what exactly is meant by “clustering”? Clustering may not mean clustering in a geographic sense [4], but the clustering of contacts between individuals. That is, the idea that certain portions of the population contact each other at a greater frequency. This could be a result of geographic proximity, or simply because of personal relationships, such as friends. The portion of the population we are interested in, in this case, are unvaccinated individuals who contact each other more frequently, either because of a preferential nature in their contacts or because of geographic proximity.
The distinction for our purposes is immaterial, as the reader shall see in the next section, but important to keep in mind when discussing the existing literature on the subject, which typically assumes clustering in the context of contacts. Truelove et al. state “If susceptible individuals preferentially contact one another, communities may remain vulnerable to epidemics even when vaccination coverage targets are met at the national level” [1]. The same authors found that this effect is especially pronounced when vaccination levels near those necessary for theoretical herd immunity, which was a result also found by Salathé and Bonhoeffer [5]. We will see this effect and more after we develop our own model to study this phenomena.
Model description
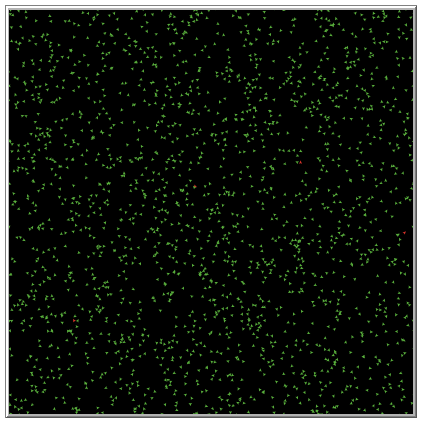
This project was quite a while ago so my knowledge surrounding it may be a little rusty. Being an agent-based model, the population in the simulation is comprised of a number of agents (duh) that move about the environment discretely. That is, at each time step (or “tick” in NetLogo), all of the agents move a certain distance in an arbitrary direction. Movement in this way can be described as uncorrelated random walks [2]. The simulation begins with the agents distributed throughout the landscape in a uniform distribution, as shown in Figure 1. The landscape is assumed to behave like a torus, in that individuals leaving one side of the environment will reappear on the opposite side. We assume our population is constant at 1089 agents spread throughout a landscape of size 33 cells $\times$ 33 cells (cells here refers to the units of measurement in the NetLogo environment). These numbers may seem arbitrary but they ensure that the agent density in the environment is 1, and the population is such that we can observe the kind of phenomena we wish to study and the simulation can be run hundreds or even thousands of times without too steep a computational cost.
Agents in the simulation possess a disease status and vaccination status. The underlying disease system of the model is a simple SEIR model, reflecting the behavior of disease transmission in a real human population. Susceptible individuals will become exposed after contact with an infected agent, and after a certain period of time (or ticks, in this case), become infected. After the infectious period, agents recover with lifelong (simulation-long?) immunity. The incubation period is of length 10 days (ticks), while individuals remain infectious for a little over 8 days on average. Regarding vaccination status, at the beginning of the simulation individuals are either unvaccinated or vaccinated. We ignored consideration of under-vaccinated individuals, although in hindsight it would not be too difficult to incorporate this dynamic. We assume the vaccine is 100% effective (not too far off from the effectiveness of the MMR vaccine against measles), and thus those agents who are vaccinated are unable to become infected. When the model is initialized, ten infected agents are generated independent of the 1089 agents already in the simulation. This makes simulations easier to compare, but at the same time introduces a bit of error when comparing the simulation results to the mean-field results (discussed more below).
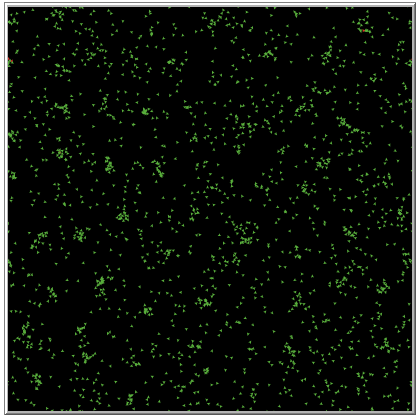
Several features of the model deserve elaboration, including agent movement and infection. Since the agents in our model move, we must be specific about what distance they move per tick, and also how they move about their environment. Each step an agent takes is a distance of one cell in the direction they are facing. In order to account for preferential contacts, agents can move according to a random scheme or a preferential scheme. The random scheme, as the name implies, is simply random movement about the environment. On each tick, an agent chooses a random direction to walk in and moves a distance of one cell in that direction. The preferential scheme is such that unvaccinated agents will preferentially seek out other unvaccinated agents within some distance, referred to as the “neighborhood radius,” mimicking the preferential contact we observe in real life. For our simulations, we set the neighborhood radius to 3 cells. If there are multiple unvaccinated individuals within this distance, a single one is chosen at random. This leads to the formation of communities of unvaccinated individuals in the environment (see Figure 2). Infection in the sense of our model occurs when a susceptible agent is both within the infective radius (denoted by $\alpha$ in units of cells) of an infected agent, and transmission occurs successfully. The latter is governed by a simple probability, which we denote by $\beta$, while the former makes things a little more interesting analysis-wise. For our simulations, we set $\alpha = 1$ and $\beta = 0.50$. The area around an infected agent in which transmission is possible is equal to $\pi \alpha^2$.
Analysis and results
Now that the model has been introduced, we can analyze it more carefully. If we assume a large agent movement distance and ignore the effects due to preferential movement, the system of difference equations describing our system at time $t$ is
where $L = 33$ is the side-length of the environment. Our infection term is simply the probability that a susceptible agent is infected by one of their neighbors. Our infection probability as it appears above is primarily spatial in scope. If we were to take an arbitrary point in the $L \times L$ environment we are considering, the probability of this point being that of an infected agent is $I_t / L^2$. If we limit ourselves to only those infected agents that are capable of successful transmission during any time step, this becomes $\beta I_t / L^2$. The probability of a point not being that of an infected agent capable of successful transmission is then $1 - \beta I_t / L^2$. Finally, the probability that all points in a neighborhood are such that they will not be infected is equal to $\left( 1 - \beta I_t / L^2\right)^{\pi \alpha^2}$. Within this neighborhood, a susceptible agent is not infected, so that
\[1 - \left( 1 - \beta I_t / L^2\right)^{\pi \alpha^2}\nonumber\]is the probability that an infection does indeed occur. For more information, see the work in [3] which derives the same result for a continuous-time system. The remaining terms in the aforementioned system should be rather straightforward. Recall that this derivation neglects careful consideration of agent movement, and essentially assumes that the movement distance of each agent is infinite (each agent is capable of jumping to any position in the environment). To see why this was necessary, we can compare it to simulation results as the movement distance for each agent slowly increases, as seen in Figure 3. Figure 3 gives the average susceptible curves relative to the total population of different systems with varying agent movement distances. The magenta curve is the susceptible proportion of the population according to the system above, absent consideration of an exposed compartment. A better fit would have been obtained if not for the fact that a baseline of ten agents are infected in each simulation.
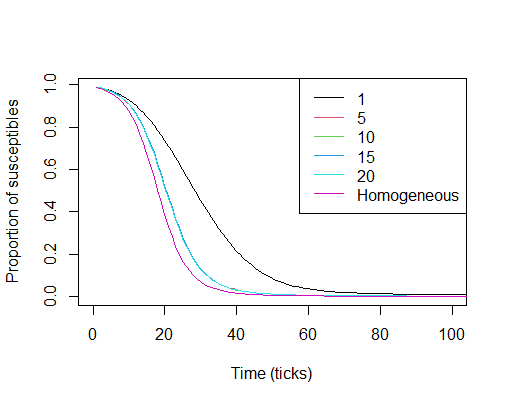
Figure 4 shows the simulation with either movement scheme versus the vaccinated proportion of the population. As the graph in Figure 4 shows, clustering can actually benefit the population as a whole by limiting overall spread of the disease to a few communities when vaccination proportions are low. Note that this is for low overall adherence, and is thus not something we should rely on. That being the case, we will not discuss this phenomena any further. Although we are able to derive a basic reproduction number for the mean-field result given above, this would be practically useless for our simulation as the mean-field result ignores finite movement. That being the case, we instead measure the effectiveness of vaccination by looking at the final size of the outbreak relative to the entire population. We arbitrarily set the standard value at 5% (as done in [1]), so that successful vaccination proportions will keep the outbreak size under 5% of the population. For larger populations this would be a ridiculously low bar to meet, but for our much smaller simulation it will suffice.
We are primarily concerned with the behavior of either system as we near the threshold of vaccination required to keep the outbreak size under 5% of the population . For the system with random movement, this occurs when 86% of the population is vaccinated. For the system with preferential movement, however, this occurs at 95% vaccination.
With clustering, one can see that the outbreak size follows a linearly decreasing trend, approximated by the formula $\theta_0(1-v^\star)=\theta$, where $v^\star$ is the vaccinated proportion of the population, $\theta$ is the outbreak size relative to the total population, and $\theta_0$ is the size of the outbreak in a completely susceptible population.
When the movement in the simulation is random, the approximating formula is $1-v^\star = \theta$. This tells us that anyone who can get infected (i.e. anyone who isn’t vaccinated) does eventually get infected in a system with completely random movement. Deviation from this linear trend occurs when the vaccinated proportion reaches the point that the vaccinated population is capable of insulating some agents from infection (i.e. herd immunity begins to have an effect). It should be noted that the proportion at which this becomes measurable is higher than what would be observed in real life, owing to the movement behavior of the agents [3]. The system with preferential contact follows a linear trend most likely as a consequence of the community composition reducing in size as the vaccinated proportion increases. In comparison, the simulation with random movement possesses a dip at a certain vaccination threshold. The point of intersection of these two lines occurs when vaccination performs equally well in both systems, which is when around 76% of the population is vaccinated. At this point, for the system with random movement, any increase in the vaccination level results in a disproportionate reduction of the outbreak size. Above this level, vaccination in the community with random mixing performs much better overall than vaccination in the community with preferential movement/contacts.
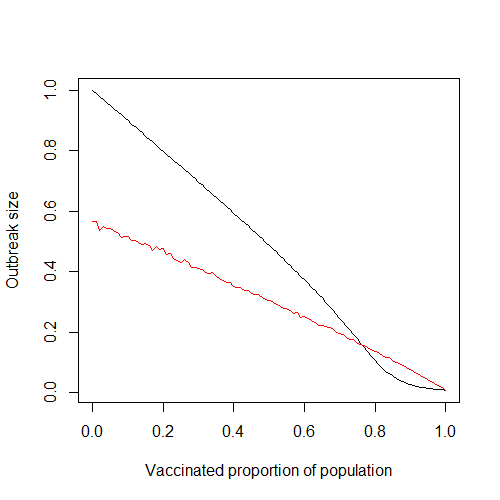
As the proportion of vaccinated individuals increases beyond around 76%, the effects of clustering become much more pronounced, agreeing with the results of similar studies [1,5].
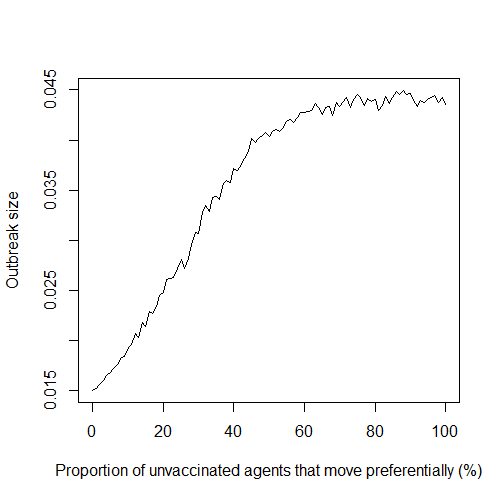
One assumption made at the beginning is that all unvaccinated individuals adhere to the preferential movement scheme. This is rather unrealistic, and represents an extreme example of preferential movement in a population. One way of relaxing this assumption is by studying how the system behaves when the probability of unvaccinated agents adhering to preferential movement is varied. We denote this probability by $\rho$. Obviously, the case of $\rho = 0%$ corresponds to the case when agent movement is random. When $\rho = 100%$ we get the results presented in Figure 4, as indicated by the red line. If we fix the vaccinated proportion at 95%, which is the vaccinated proportion required to keep the outbreak size below 5% on average, and let $\rho$ vary, we get the graph given in Figure 5. The curve rises sharply as adherence increases, indicating that even a small amount of preferential movement is enough to alter outbreak size quite substantially. Note that this is for a fixed vaccinated proportion near the elimination level in the population. Expectedly, this effect depends on the vaccinated proportion of the population, as discussed next.
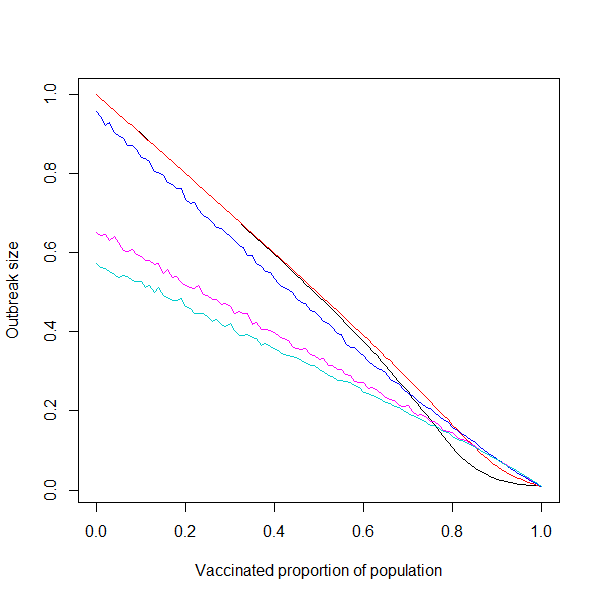
This phenomena is explored further in Figure 6, in which various plots are given comparing different values of $\rho$ over allvaccinated proportions, and not just a fixed amount as in Figure 5. Lower adherence leads to larger outbreaks, as agents are not as confined to their clusters/communities as would be the case with higher values of $\rho$. The possibility of between-cluster transmission becomes much more likely when both the vaccinated proportion of the population is low (and thus more agents comprise each cluster) and the value of $\rho$ is low. The same qualitative effect that adherence has on outbreak size (Figure 5) is observed in the curves given in Figure 6. Specifically, the difference in outbreak sizes between 50% and 75% adherence is far greater than the difference between all other consecutive lines, indicating a quick increase in overall effect between these two values of $\rho$.
The slope of the lines corresponding to the higher values of $\rho$ given in Figure 6 is “less negative” than the slope of the lines corresponding to the lower values of $\rho$ (0%, 25%, and 50%). Thus, increasing vaccination in a system with higher preferential movement adherence will produce an overall lesser effect on outbreak size than increasing vaccination by the same amount in a system with lower adherence. This is understandable, as larger values of $\rho$ we would expect make the system more resilient to change. The fact that this change is the same at all vaccination levels is not so intuitive, but this gets back to our earlier discussion of the linear relationship between the outbreak size and the vaccinated proportion of the population.
Discussion
With a simple agent-based model in NetLogo, we were able to observe how preferential contact between unvaccinated individuals can increase the elimination threshold of vaccination in order to prevent outbreaks of a certain size from occurring. The average outbreak size of a system with preferential contact/movement decreases linearly as the vaccinated proportion increases. We also found that the effect of clustering increased dramatically after the point at which vaccination performed equally well in both systems, especially near elimination levels.
References
[1] Truelove, S. et al. Characterizing the impact of spatial clustering of susceptibility for measles elimination. Vaccine, 37 (5): 732-741, 2019.
[2] Fofana, A., and A. Hurford. Mechanistic movement models to understand epidemic spread. Philosophical Transactions of the Royal Society of London. Series B, Biological Sciences, 372 (1719), 2017.
[3] Buscarino, A., Fortuna, L., Frasca, M., and V. Latora. Disease spreading in populations of moving agents. Europhysics Letters, 82 (3), 2008.
[4] Lieu, T. et al. Geographic Clusters in Underimmunization and Vaccine Refusal. Pediatrics, 135 (2): 280-289, 2015.
[5] Salathé, M., and Bonhoeffer, S. The effect of opinion clustering on disease outbreaks. Journal of the Royal Society Interface, 5: 1505-1508, 2008.